NIC MAP ® Quarterly Metrics
Data as of 2022 Q2
View Data History
Definitions
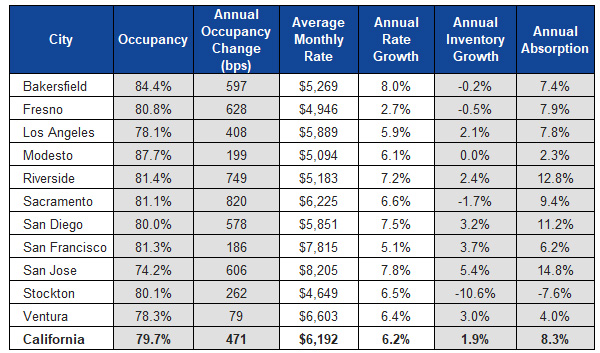
Annual Absorption – The percent change in occupied inventory from one year ago.
Annual Inventory Growth – The percent change in inventory from one year ago.
Annual Rent Growth – “The inventory-weighted annual growth rate of average rent for properties reporting rent data in the both the current quarter and the same quarter a year ago.”
Average Monthly Rent – “For properties, this represents the inventory-weighted average of asking private-room market rents in the dominant care segment of the specified property type. For majority independent living and majority assisted living properties, this represents one month’s base market rent plus the average care service fee.”
Inventory – “The number of independent living units, assisted living units, memory care units, and nursing care beds that are operational and available for residence. One unit of independent living, assisted living, or memory care is equivalent to one nursing bed.”
Majority Assisted Living – “Properties where assisted living units and/or memory care units comprise the largest share of inventory. Residents receive personal care services such as assistance with bathing, dressing, eating, walking and toileting. Twenty-four hour protective oversight is provided, but twenty-four hour medical care is not. The majority assisted living properties included in NIC MAP are only market-rate properties where 80 percent or more of the residents are 55 years or older.”
Occupancy – “The amount of occupied inventory in reporting properties divided by the total inventory of those properties.”
Annual Occupancy Change – The change in occupancy from one year ago. This is measured is basis points (bps). A basis point is equivalent to 1/100 of a percentage point.
Data copyright: 2020 National Investment Center (NIC). All rights reserved. www.nic.org; www.nicmap.org. NIC MAP reports data on market rate (25+ beds/units) majority Assisted Living communities. These are defined as communities where Assisted Living units and/or memory care units comprise the largest share of inventory, and can include freestanding, combined, and CCRC campuses. Quarterly metrics are based on property data obtained through both direct submissions from corporate offices and contracts with the ProMatura Group which actively surveys market rate communities located in each of the top 100 metro markets. This data is then reviewed and audited for accuracy. Therefore, data reported by NIC MAP is not representative of all licensed RCFEs in California. However, it offers an accurate perspective of a segment of this model of care.